• Skip to primary navigation
  • Skip to main content
  • Skip to primary sidebar

shochu & whiskey

tasting and distilling stuff

  • About
  • Finance
  • Books

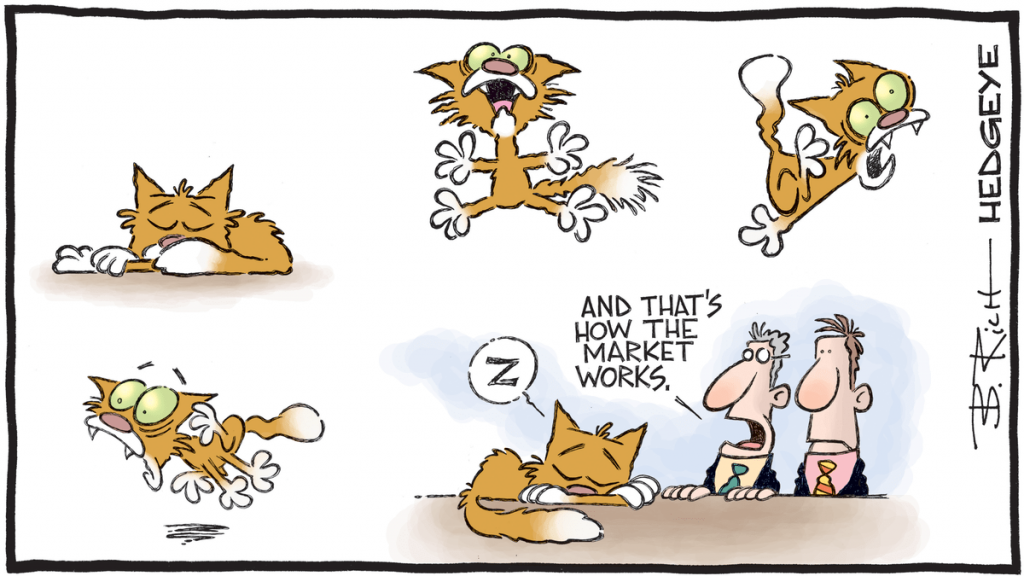
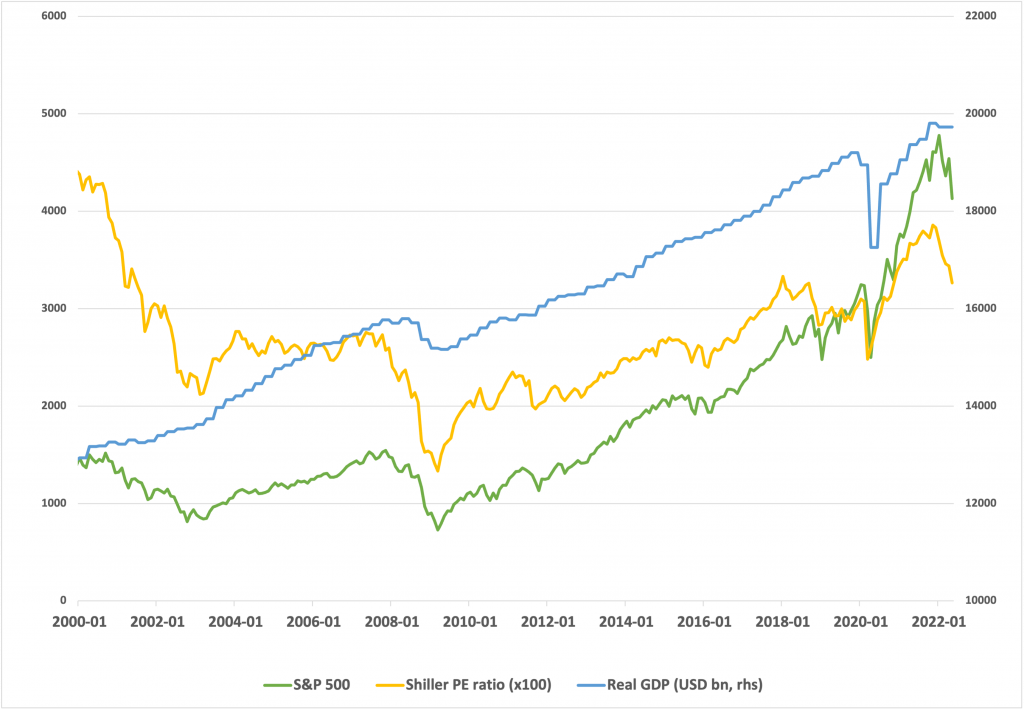
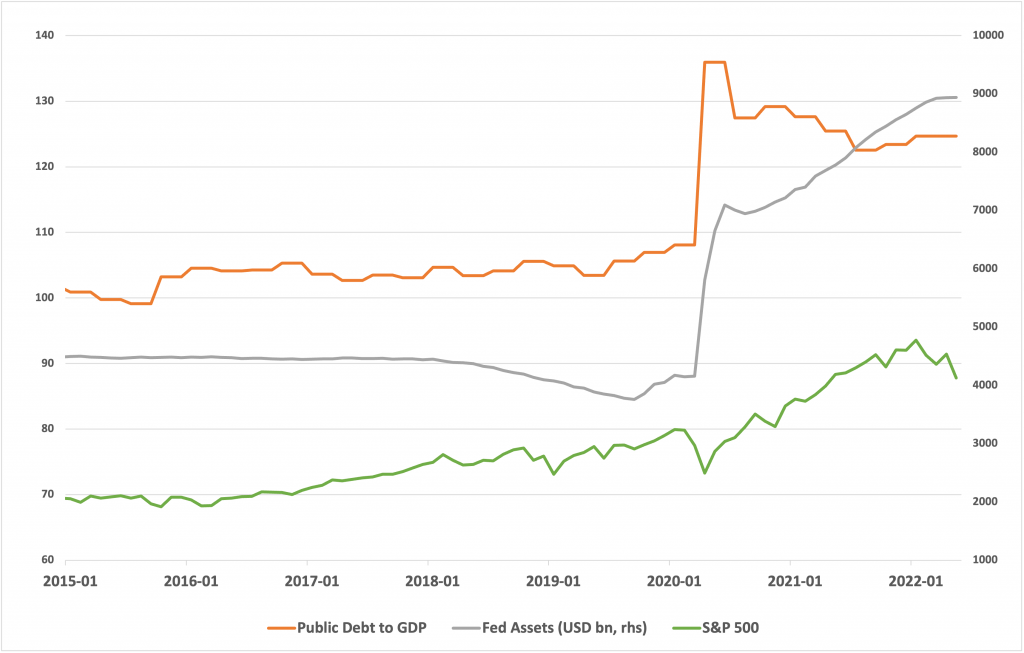
Snapshot of the global clusterfudge. But really, the UK.

by Jennifer Kapila

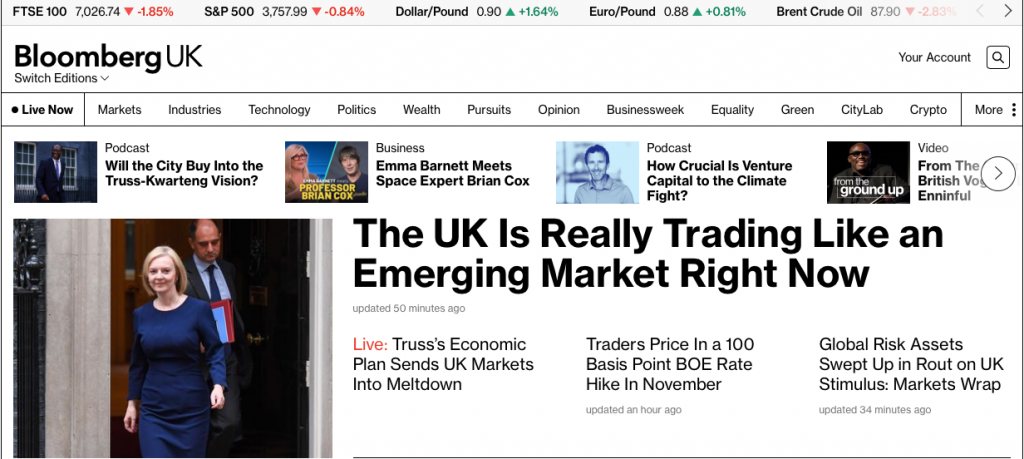
Front page of my Bloomberg this morning.

Monday, the country mourned the passing of the Queen, the only royal I cared about. No one does imperial pomp and pageantry like the UK. Just think about how many sci-fi costumes the different UK regimental uniforms have inspired. It was also a bank holiday with many shops shut, i.e. yet another mark against UK GDP.

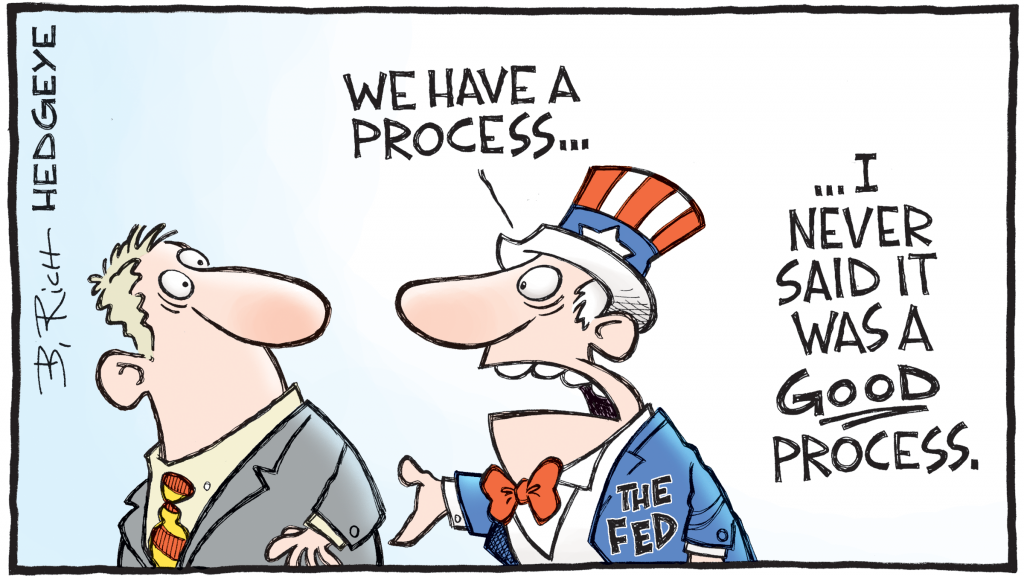
Wednesday, the Fed hiked rates 75bps and said they were fine with recession. At the time of writing, the S&P 500 at 3687 is within spitting distance of the summer lows. Somehow this was the wake up call for equity markets? Now they seem to understand the recession will suck for earnings and that the Fed is not for turning. Credit, of course, didn’t bat an eye.

And because things aren’t going great for Russia’s invasion of Ukraine, Putin dangled the nuclear threat and said he needed 300,000 more fighters. Conscription, draft for the Americans. Flights out of Russia sold out as people who could afford it, fled.

The BOE raised rates 50bp to 2.25 because inflation is over 10%. Nothing to do with UK gov getting rid of all of our gas storage…

Then today, PM Truss and Chancellor Kwarteng announced their ‘plan’. A plethora of tax cuts for people who don’t need them, a race to the bottom on corporation tax, and a lifting of the ban on fracking. This following the announcement a week ago of a questionable blanket price cap on energy. All this sent the pound down AGAIN, drew comparisons to the Turkish lira and emerging markets, and has everyone with an iota of economic comprehension and banking experience calling it a huge ‘gamble’ that will end in tears. I pity the BOE. It’s like they’re trying to get the water out of this sinking ship and UK gov is trying to find the biggest drill bit to play with.
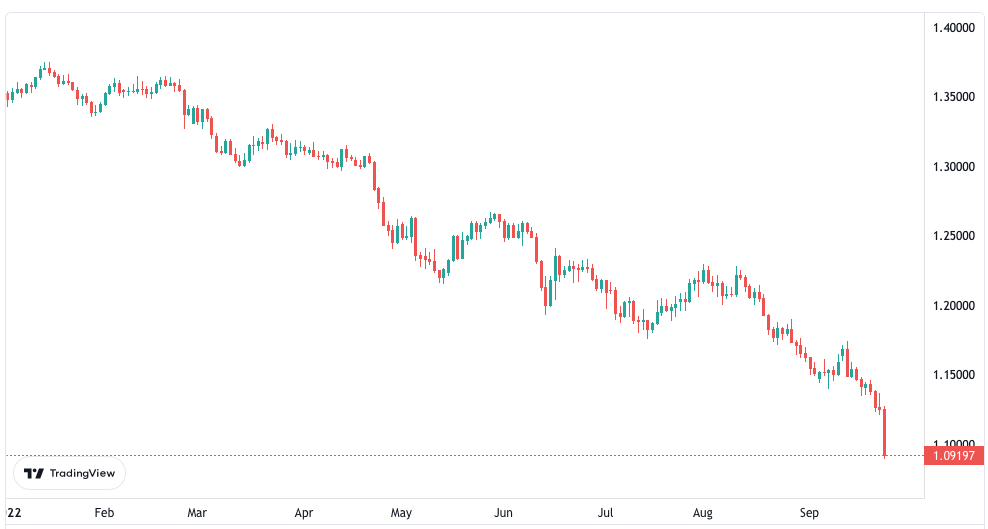
Look at that pound drop.

And then, like a radioactive cherry, Hilary Mantel died.

The curse/blessing of American confidence - Week in Review - 02 September 2022

by Jennifer Kapila

S&P 500 at 3988 at the time of writing, just over 300 points off the August peak, and 65 points off Friday’s close when markets seemed to interpret the Fed Chair’s speech at Jackson Hole as ‘surprisingly’ hawkish. 75bp hike in September was put firmly back on the table but payrolls today may have people doubting that again.

The Euro Area continues its descent toward recession as the big economic data points - sentiment, inflation, etc - continue to drift in a negative direction. And the pound, of course, continues to slide. Somehow appropriate for a country unable to contain its own sewage water.

Like last week, Friday was the ‘big’ day stateside, but this time for U.S. jobs data. A plethora of data came out this week - JOLTs, jobless claims, nonfarm payrolls, ADP - but it didn’t paint a particularly clear picture to this definitely-not-an-economist. Payrolls were down from the previous month, in line with consensus, and unemployment rose, supposedly on the back of more people entering the job market. On the other hand, job openings increased instead of falling as expected and jobless claims fell instead of rising as expected. One set of data hints toward easing of labor market tightness - positive for reducing inflation - but the other suggests the opposite? Still, inflation is high. How the hell does the American consumer confidence remain so buoyant? It has nothing to do with the fact that Americans are curse-blessed with a surfeit of overconfidence. Does it really just come down to the number at the gas pump?

Of interest (to me) was news that chipmaker Nvidia was hit by new restrictions ‘governing the export of artificial-intelligence chips to China’. Unclear how much of this is simply sabre-rattling ahead of mid-term elections, it’s hard not to view this as just one more sign - along with the CHIPS act, U.S. visits to Taiwan, Russia-India-China wargames and the increasing attractiveness of the yuan as a reserve currency to Russia - of hardening relations with China and a broad trend toward de-globalisation.

Week in Review - 26 August 2022

by Jennifer Kapila

Market prices are little changed - S&P down, yields up - from the end of Friday of last week, maintaining a holding pattern ahead of the Fed Chair speech at Jackson Hole later today. Though it seems unimaginable that he’s going to provide any meaningful deviation from what he’s already said many times before. Trying to talk down markets when U.S. stocks have the investment equivalent of MFN status seems like a pointless task.

If anyone thinks Europe is not already at war with Russia, they are not paying attention.

The average energy bill for UK households will reach £3500 in October (and will continue to rise), which is about 3x the rate we paid a year before; buses will be crowded as people, unable to turn on the heating in their own homes, struggle to stay warm. Even though the UK is less dependent on Russian imports than its European neighbours and has increased the amount of renewables and nuclear to the mix, we still use more gas AND, in a stunning example of forethought, nixed our gas storage, leaving us at the mercy of volatile spot prices. The pound may be heading to parity - a short term ‘superficial’ benefit for the global companies that report in pounds on the FTSE - but terrible news for inflation as a net importer. Industrial action is becoming a regular part of life here. Crime and civil unrest are correlated with economic plight and for the first time ever in the UK, I am concerned about our safety in the approaching dark winter evenings. I can only hope this winter is a mild one.

Quick fixes are the name of the game in China and the U.S.

The Chinese government announced a stimulus plan aimed at infrastructure spending and sustaining housing demand but market non-reaction suggests this won’t accomplish much. Of more interest (to me) is the hope that Chinese companies will strike an agreement with U.S. auditors and avoid delistings. The delistings themselves don’t seem to *really* matter to an China ETF investor, but it wouldn’t be a good look.

The U.S. announced its own mini stimulus measure with Biden’s plan for student loan forgiveness. It is expected to be very mildly inflationary (0.2pp). The bigger concerns are that this 1) follows on the footsteps of painstaking efforts to create policies that would not be inflationary and 2) appears to be a transfer of wealth from people who have not attended college to those that have. Widely viewed as a political sweetener ahead of U.S. midterms, it’s a slippery slope to make debt forgiveness a policy tool in a credit-driven economy.

Price Leads Sentiment - Week in Review - 19 August 2022

by Jennifer Kapila

I’m trying to find more focus for this blog so I can improve the regularity of my updates. This post is one such attempt, an idea for a weekly review of my most important takeaways from the market activity. Really, it’s just a way for me to parse out justifications for the financial decisions I’m (trying to) make.
This is not investment advice. Maybe the monkey will hammer that point home.

Where are we now?

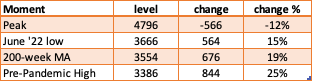
At the time of writing, yields on the 2 and 10-year UST’s are 3.27 and 2.98. The S&P 500 is hovering around 4230, down about 50 points from the end of last week. Not much change for but for some context:
All the market commentators talk about where we are from the high (down 12%) but I like to look at where we are compared to the
level just before the March 2020 pandemic crash (up 25%) because I often wonder if our economy is fundamentally any ‘better’ or even larger than it was at that point in time, given that 1) Fed easing and the fiscal stimulus have been inflationary, especially for risk assets, 2) the U.S. is heading into recession and China is sinking, 3) um, global energy crisis, and 4) we’re still unwinding the effects of 18 months of pandemic-induced shutdown.

What’s the wrap?

The outlook for the US economy is still not great and headed for recession. Inflation may have peaked but it’s still high and expected to be sticky. Houses are not selling. Sentiment is weak. Corporate earnings, once you strip out the energy sector, are starting to feel the pinch. And while the job market is still looking strong, all that data is backward looking. But it’s much worse in Europe. So. Much. Worse. And yet here in the UK, no one is talking about energy security because the Conservative leadership is screwing about, talking about, of all things, tax cuts. WTAF.
China’s economy is getting fugly, fast. The latest set of macro data - retail sales and industrial production - suggest it is slowing faster than expected. You know it’s bad when the PBOC pulls a surprise rate cut a few days after claiming they would ‘safeguard the economy against inflation threats‘. This is not just a temporarily self-inflected wound caused by the zero-Covid policy. This has been decades in the making, i.e. years of spending to pump up the economy - remember all those articles on ghost cities and shadow banking and zombie SOEs? - all in the name of hitting those elevated growth targets and creating a middle class. Sounds bad for commodities, for a long time…
Until this, Friday, morning, it was risk on for stocks and crypto even though the yield curve is inverted, albeit less so than last week (10-2 spread 30bps at time of writing). Though credit spreads have slowed their roll. Hmm. Most ‘experts’ hate this rally, viewing it as unjustified given that the Fed is still tightening (via rates AND quantitate tightening) and we’re only just beginning to see the impact of sticky inflation and Fed policy on the various sectors of the economy. But some houses caved and, reluctantly, become less bearish. Hence the title of this post ‘price leads sentiment’. Doesn’t matter how you feel about fundamentals, the market will make you constantly question your sanity.
Photo by Jared Rice on Unsplash


why stocks HAVE to go down…or not

by Jennifer Kapila

Stocks are down roughly 20% from the beginning of the year (at the time of writing), the largest drop since the ‘rona put the fear of God into the markets in March 2020. To state the blindingly obvious, uncertainty is high - energy costs remain high, global supply chain are still gummed up, and central banks are foxed, stuck between recession and inflation risk. The talking heads are of little help, the narrative of the day driven by whether the numbers on the screen are green or red.

The vast majority of us do not have the time, skill or resources to develop a deeply informed view of the markets. Because of this, the received wisdom for personal investors is to practice ‘dollar cost averaging’, which is basically drip feeding a regular amount of your disposable income into the market at a regular income, eg. 10% of your paycheck every month. I agree with this idea up to a certain point, but it does fly in the face of that small print in every single financial prospectus I have ever encountered: ‘past performance is no guarantee of future results’.

Again, here I feel the need to caveat any potential reader that 1) this is not financial advice and 2) my incorrigible bearishness has resulted in me having missed out on a ton of potential gains.

So, as someone bent on making life difficult by trying to time the market but also lacking a lot of resources to justify such hubris, how do I make the tiniest bit of sense of the risks ahead? Questions. I ask lots of questions until I find one I’m confident I can tackle. Often times I can’t actually answer the question, but I never fail to learn something in the asking.

Does the stock market move in line with economic growth? Should it?

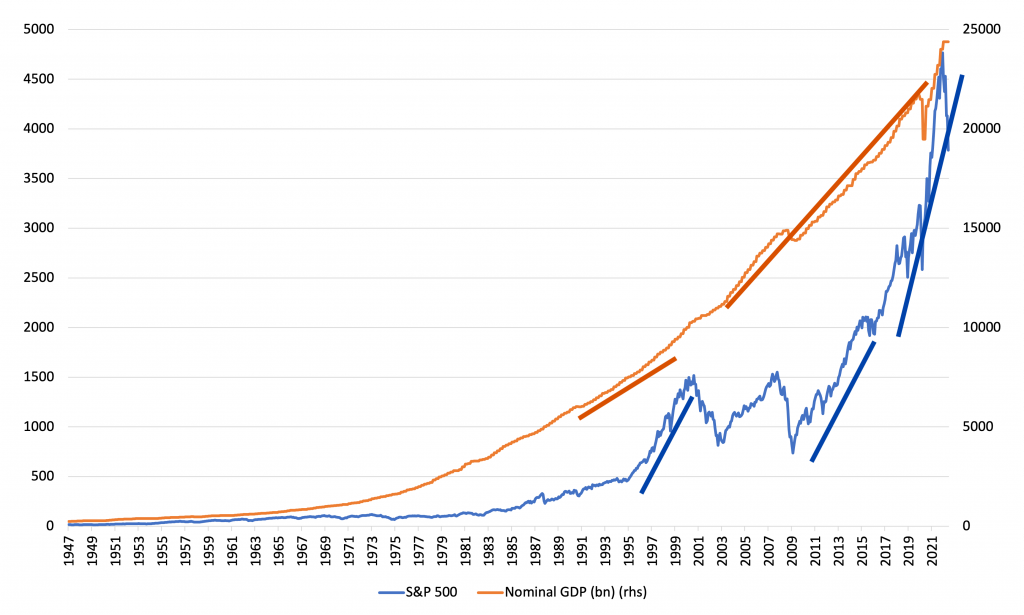
I’ve always been uncomfortable with the stock market trajectory. Just look at the chart below, which plots the S&P 500 against nominal GDP.

Data source: FRED, DataHub

Putting aside whatever thoughts I have on that nominal GDP line (and I have some), check out the slope of the S&P 500 (the blue line) in the late ’90s. After a long period of seemingly steady growth, the stock market starts to accelerate, clearly outstripping the growth of the real economy (represented by the orange line, nominal GDP). After 2 big bear markets, we see this acceleration resume beginning in 2009. To me, these are periods of excessive, or unwarranted growth and could mean a big fall is coming.

There are a number of reasons why the stock market can grow (or contract) faster than the real economy.

  1. survivorship bias - an index like the S&P 500 weeds out companies that fail/die whereas GDP reflects the ‘losses’ of company failures
  2. selection bias - companies have to jump through many hoops to be publicly listed so it is usually only the more stable and more successful entities that are available to be traded
  3. foreign earnings - the largest companies are global and generate a significant amount of earnings from faster growing foreign markets
  4. valuation changes or multiple expansion - GDP is an estimate of total actual output. Stock prices, however, reflect sentiments on risk, supply and demand, and the future. so, for example, if there is a mad rush for Stock X because of some rumour on reddit, the price can rocket even if there is no change in its earnings. the same cannot be said about GDP.
  5. deregulation - by reducing certain barriers and restrictions - possibly intended to protect consumers or the environment? - deregulation can, in effect, increase the size of the pie available to an industry, or create a new one altogether. this can boost GDP as well, though the effects on the market participants may be outsized.
  6. technological change - like deregulation, major technological change - eg the dot com and internet era - can create a wealth of new businesses and industries, hopefully more than the ones they destroy.

Now, in spite of all of those reasons (which are not exhaustive), I personally don’t believe the stock market can significantly outrun economic growth indefinitely.

What does that mean? I can buy the idea that the stock market can grow 8% while nominal GDP is growing only 5% for an indefinite period, i.e. for many years on end. And for any given year, it’s possible for the stock market to grow (or contract) at twice, maybe even triple the rate of nominal GDP. But the stock market growing at 3-4 times the rate of nominal GDP for several years? No, that is simply too good to be true and demands a pound of flesh at some point. Because no matter how divorced earnings get from the real economy, the two are still fundamentally connected.

The market has been speeding well over the limit

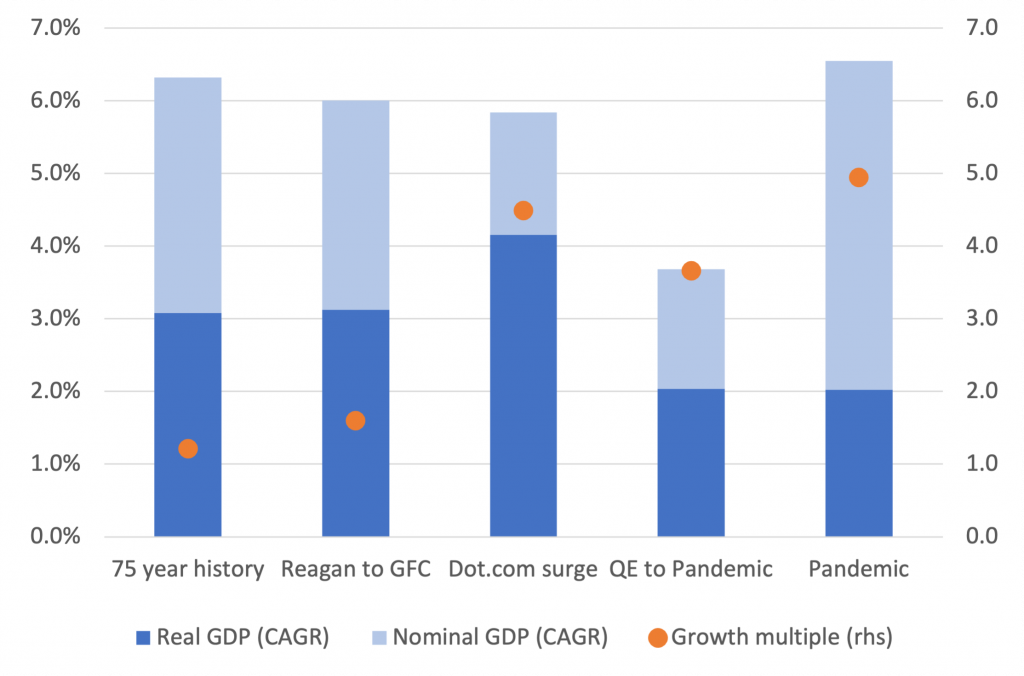
The chart below illustrates how wildly the market has been speeding while providing some insight into the causes. The bars show the compound average growth rate of real and nominal GDP (left hand axis) while the dots show how fast the S&P 500 was growing relative to nominal GDP (right hand axis) over the same period. Over the last 75 years, nominal GDP has grown 6.3% per year while the S&P 500 has grown at 7.7% per year, or 1.2 times the rate of nominal GDP.

Data source: FRED, DataHub

Following the Global Financial Crisis (GFC) and aided by very loose monetary policy (‘QE’), the market grew, on average, 13.5% per year for 11 years. That may seem tame compared to the heady ’90’s but it was almost 4 times the rate of growth of the economy, and for double the amount of time as the dot com surge! The market only accelerated in the 2 years following the pandemic crash, when the Fed added more fuel with further easing. This would suggest a lot of unsustainable gains embedded in the market.

You might say, ‘the world has fundamentally changed, and you can’t compare recent growth rates to a 75-year history’. But even incorporating the wide-ranging effects of Reaganomics, financial deregulation and the dot com era (‘Reagan to GFC’ series), the growth rate of the market was well below 2 times nominal GDP.

The next logical question is then -

How bad could it get? How long would it take to return?

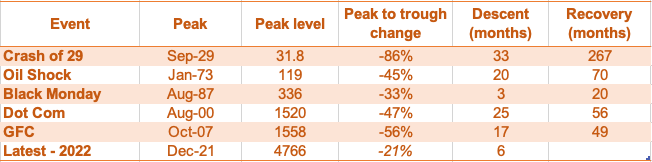
The bajillion dollar question. But I start, again, with history. How bad were previous ‘crashes’ and corrections and how long did it take to recover? And by ‘recover’, I don’t mean how long did it take to return to bull market territory (vaguely defined as a sustained increase of 20%), I mean how long did it take to return to the pre-crash level? In other words, if before the crash the level was 900, then it went to 600, how long did it take to return to 900?

Based on monthly data so exact figures may be slightly off

Check out the 1929 crash. It took 33 months to reach it’s lowest point - a fall in value of 86% - and then 267 months (over 20 years!) to return to it’s pre-crash level. On the other hand, the Black Monday crash was relatively short lived, but it still took almost 2 years to recover to the pre-crash level.

Looking at these historical data points - which again, are not exhaustive - a 40% drop from the top and a 48-month recovery time is not out of the realm of possibility for today’s situation. At the time of writing, the S&P 500 was around 3800, down roughly 20% from its peak; a 40% drop in total would take us down to around 2900. Then again, the current situation is not exactly comparable to those previous periods. It could be much better. Or not.

So what’s different this time

A financial or economic historian would answer this question better than I could, but from what I can tell, this is what’s different today, compared to previous crashes:

Why things might be better this time:

  • no world wars (fingers crossed)
  • no depression or severe recession on the horizon; a mild recession seems to be the worst things on the cards at the moment
  • a more sophisticated central bank with a long history and new tools in its arsenal
  • less levered private sector - business and households - balance sheets (compared to the GFC)*

Why things might be worse this time:

  • overstretched central bank balance sheet and the inevitable threat of QT
  • jammed up supply chains and logistics due to pandemic hangover —> sticky inflation
  • a more leveraged public sector, thanks to all the stimmies
  • restricted energy supply, even if Russia-Ukraine conflict is magically resolved tomorrow
  • global trend of pre-emptive rate hikes, and all the lovely currency effects that entails
  • China - covid lockdowns, regulatory crackdowns and more fraught relationship with U.S. business - is a big unknown

*This is a commonly touted point, but I’m not entirely convinced. Yes, household debt is down compared to 2008, but if inflation remains high and rates rise too fast, people will struggle to keep up with mortgage payments. Pundits keep claiming that companies are cash rich and have strong balance sheets, but from my very superficial look at a handful of data points, it seems businesses, on aggregate, have increased their debt since 2008.

The one chart that won’t let my negativity die

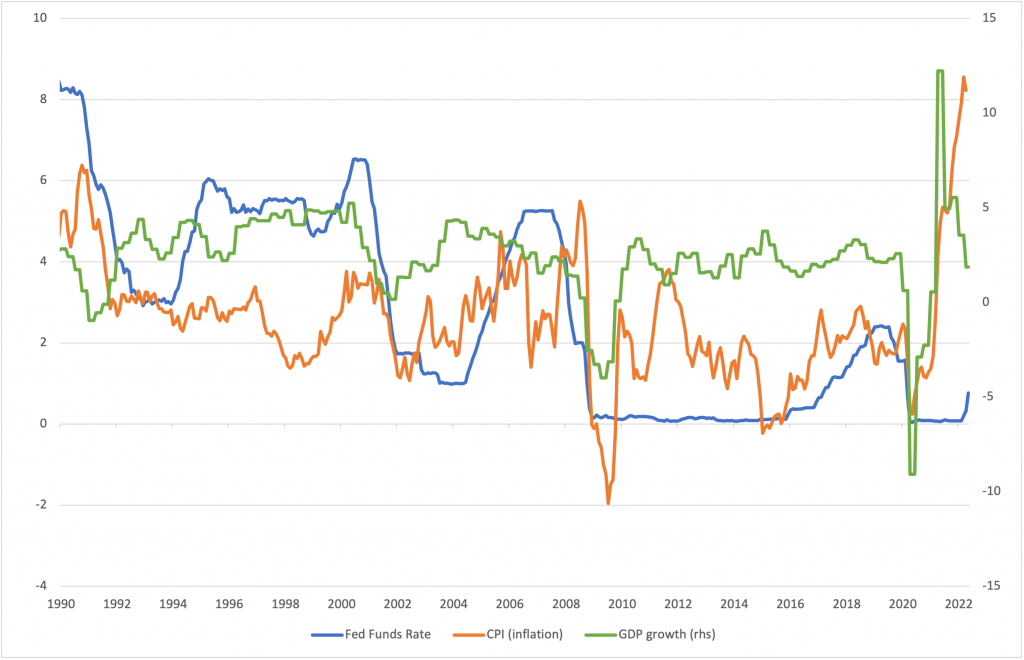
As I’ve mentioned in a previous post, I come from a credit background so I’m primed to focus on downside risks. I’d like to think things won’t get much worse from here, to fall back on the age-old trust in the resilience of the U.S. economy. My problem is this chart.

If you get it, you get it. If not, I’m leaving it to the next post to explain it. This one has gone on long enough.

the ouroboros of growth, rates and inflation

by Jennifer Kapila

ouroboros: a circular symbol depicting a snake swallowing its tail, as an emblem of wholeness or infinity

-Oxford Languages

a gnostic and alchemical symbol that expresses the unity of all things, material and spiritual, which never disappear but perpetually change form in an eternal cycle of destruction and re-creation

-Britannica

ouroboros on the tomb of Tutankhaman

Why this reference? For one, ‘alchemy’ and ‘destruction’ feel like appropriate words when conjuring the realm of central banking. But on a more serious note, growth, rates and inflation are broadly interdependent. When expectations for one of these factors changes, the expectations on the others usually shift as well.

Growth, the deity of stocks and finance

Growth is the change in the output of an economy over a certain period of time; a positive change is an expansion (‘good’ or supportive for stock prices), a negative change is contraction (‘bad’ for stock prices). To measure this, we usually look at the change in real GDP (gross domestic product). For comparison, an individual’s ‘annual GDP’ is their salary, or the total sum of their wages over a year.

Economic growth = (GDP of year 2 / GDP of year 1) - 1

Economic growth is affected by anything that affects jobs, credit and the sale of goods ands services. Think war, pandemic, technological change, deregulation, population expansion or contraction. Russia’s invasion of Ukraine has brought the economy to a halt - people are either fleeing or fighting, they’re not going to the farm, office or the factory, which means no goods or services are being provided. Roads are blocked or bombarded, meaning little is getting transported, within or without. The global pandemic created economic disruption, ultimately through hospitalisation or quarantine.

On the flip/positive side, the financial deregulation of the early ’90s unlocked massive credit creation, which spurred consumption and investment. Waves of technological innovation - from the internet boom to cloud computing and fintech - have fundamentally changed our day to day life, improving productivity and spurring new jobs and industries. Monetary and fiscal policy can stimulate and crimp growth as well; anything that loosens financial conditions or puts more money into the pockets of individuals and corporations is generally viewed as growth positive. But these growth positive policies can quickly tip over into undesirable inflationary pressure.

Inflation is the change in the purchasing power of money. It is also described as the change in the price level. If your salary/wages have been $35k for the last 3 years, your ‘real’ salary/wages have fallen as inflation has eaten away at your standard of living (through higher prices of groceries, energy, services, etc).

Nominal salary* = real salary + inflation

Real GDP = nominal GDP - inflation

*We generally speak of salaries in nominal terms and GDP in real terms.

Inflation, that thing no one understands but everyone feels

Inflation is generally thought of as demand-driven - i.e. too much money chasing too few goods - or supply-driven - i.e. a rise in producer costs or a supply shock - but anything that significantly affects growth will probably affect inflation. Take the Russian invasion of Ukraine; the result has been a supply shock (constraint) in oil and gas, and consequently, a significant increase in energy and grain prices. Higher commodity prices mean less disposable income for consumers and lower margins for producers, leading to less consumption by the former and less investment by the latter.

The pandemic brought factory production and shipping to a halt, leading to a shortage of cars and therefore, price rises akin to highway robbery in the secondhand car market. Yet as economies open up and tourism begins to take off, airline ticket prices are rocketing, a combination of a severe jump in demand for travel, higher energy costs and weaker infrastructure/supply (thanks to all the layoffs of airport and airline personnel during the pandemic).

Policy wise, there have been significant inflationary pressures in the pandemic era, from the enormous fiscal stimulus packages to the massive expansion of the Fed balance sheet. (Remember in the previous post I mentioned the collapse of stock prices due to expectations? It was these policy actions that shored up markets.)

today: low rates, inflation spiking, growth falling

It is easy to associate rapid growth with rapid inflation and weak growth with weak inflation, but this is not always or even mostly the case. Every policymaker desires the goldilocks situation of rapid growth and low inflation, which we have benefited from for many years. But no one wants what we may have now - weak growth and high inflation, also known as stagflation.

Rates, the reason you can/can’t buy a house

Rates, or rather interest rates, are the price of money, or the cost of borrowing. When you put your money into a savings account, the rate you are paid is the bank’s cost of borrowing from you, the individual. The fact that most of us have received nothing for keeping our money in the bank should tell you that money over the last decade, at least for a special few, has basically been free. There are many interest rates, and the rate will depend upon the riskiness of the borrower; the US government can borrow more cheaply than Apple, and Apple can borrow more cheaply than any of us mere mortals. But central banks can directly manipulate all of these rates through the Fed Funds Rate, or the benchmark interest rate, the goal being to nudge growth and inflation in a certain direction. It is a powerful tool but it’s neither timely nor accurate; think of it - or really any monetary policy tool - as using an axe to carve a paperweight.

When an economy is growing too fast or inflation is running hot, central banks will look to raise rates to cool things down. The rate change will have a a knock on effect on borrowing costs, for would be homeowners, corporations and investors, and therefore reduce spending, consumption and investment. But if the the bank hikes too much too fast? It could tip the economy into recession, i.e. more people will be out of work and spending less (and more likely to engage in civil disobedience or crime. Yes, crime is associated with economic strife. Big surprise).

On the other hand, when an economy is flatlining, central banks will look to cut rates to stimulate credit - think of how all those 0% down ads for that new couch or appliance affect spending behaviour - and therefore consumption. The problem is if the benchmark rate is already at or near 0%. In such cases, central bankers cough and nod to lawmakers to do something in the fiscal area (think stimulus checks or infrastructure spending). But if economy is stalling that badly, there’s a good chance lawmakers will sit on their hands, in which case central bankers have to resort to more extreme measures, most notably, large scale asset purchases.

So, back to the ouroboros. Everything affects everything else. Interest rates - and more ‘extraordinary’ monetary policy tools - affect growth and inflation through the cost of borrowing. Inflation/deflation affect economic growth through consumer spending and business investment. Central banks watch both inflation and growth trends (among *many* other things) to determine rate policy. The problem is when growth is weak and inflation is too high. What do central banks do then?

stocks and markets 101

by Jennifer Kapila

Every time I start to look at the markets after an extended break, I go on a research and data binge: What is the market PE ratio now? What is the shape of the yield curve? What are employment levels? House price trajectory?What do household balance sheets look like? What about corporate balance sheets? What are high yield credit spreads doing? What did the last few PMI surveys show? What’s the latest on monetary policy guidance? And this list doesn’t even touch the many other questions related to time-specific risks like the war in Ukraine or a global pandemic.

I get easily distracted doing this research, trying to remind myself of the differences between the myriad time series for unemployment and inflation. Too often, a headline will raise a new question and steer me to a new data point I hadn’t even considered. And because I get distracted, I lose the big picture. I forget the whole point of my research, the question I am trying to answer, which is essentially this: should I buy, hold or sell stocks now?

That question assumes I have a choice as to when I can enter/exit the market (here, using a broad market ETF like SPX as a proxy). I am not a long-only fund manager that struggles to sit on cash for a long time. I am also not drip feeding money into the market via a corporate pension fund or robo adviser on a pre-set monthly date; this flexibility sounds great, but in reality, timing is hard. Professionals are paid millions to get it right. I preferred the days when I didn’t have to think about market entry points and am fully aware that I am making life unnecessarily difficult for myself.

The following posts on investing are not intended to provide financial advice but to remind myself - and friends who have asked, maybe kids who are interested - what essential questions to focus on and why. I am not a paid financial professional, though my job - and everyone’s job, no matter how little savings you think you have - is to figure out how to keep and grow the money we do manage to earn.

A few caveats

  • I am not a financial professional. I left the world of finance almost a decade ago and even then, I wasn’t on the equity side or the buy side. This is not advice. I don’t even know if I have to say this but don’t say I haven’t told you so.
  • I am not, and never have been, an economist. Don’t ask me technical questions about productivity and trade imbalances, because I DON’T KNOW.
  • I come from a credit background, and our ilk usually focus on downside risks because as a bondholder, the best you can get is par (the full amount of principal owed to you). There is no potential for unlimited upside like in equities. But I’d argue I thought this way well before I entered the world of credit research; I’ve always been paranoid about downside risks because of my somewhat dystopian views of the future of ‘civilisation’…
  • U.S.-centricity. Even though I am based in the UK, the benchmark is the S&P 500 and all the data points are U.S. economic data points and when I talk about treasuries and monetary policy, I’m talking about U.S. public debt and the Fed. Whether you like it or not, it’s the largest, deepest financial market in the world and it has a huge effect on all the other dinky little ones. KIDDING. But not.
  • A lot of this information will be blindingly obvious and lacking in nuance to investors and financial professionals. Obviously these posts are not for you. Though even when I did work in a bank, it took me a while to fully appreciate how all of these things truly fit together because no one sat me down and walked me through these basics. And even if they did, it would still take years to truly integrate the knowledge into my critical thinking.

The one question you gotta ask: ‘Do I feel lucky?’

Stock prices are all about expectations. I’ll talk about specific factors that go into stock pricing but ultimately it always comes down to EXPECTATIONS - a function of data, biases and feelings - about future growth. The stock market is an emotional barometer for the health of the economy. If this all sounds like a big ass gamble well, I am not the person to disabuse of such an assumption. But I did say data was involved so it’s not entirely a monkey-and-dartboard situation.

Whatever market index - or specific stock or bond - you choose to focus on, the first question you need to ask yourself is: what expectations/assumptions are baked into the current pricing? There are MANY assumptions embedded in pricing, but they generally funnel into two essential ones: growth and interest rates (i.e the cost of borrowing). If tomorrow, the market drops or rises 10%, it means expectations about future growth have changed. Once you’ve established the market’s assumptions, the next question you have to ask is: what risks or events could subvert those expectations?

The transmission mechanism: GDP, rates and net present value

Let’s get granular for a moment. Even if you don’t want to pick stocks - I certainly don’t - there is a point to understanding this.

I mentioned before that pricing is a product of many assumptions. What exactly are those assumptions? In other words, how do equity analysts generate price targets for a stock, which helps us determine if a stock is cheap or expensive?

There are a number of valuation techniques, but the one that is perhaps the most established - or at least, the one that was always in my finance books - is basically a net present value (NPV) model. They estimate future earnings - dividends for DDM or cash flow for the DCF method - out several years and then discount those amounts to the present day. Both models require 1) a growth rate and 2) a discount rate, a.k.a. an interest rate. You don”t have to know the equation. All things equal, this means that an upward revision in economic growth (GDP) will push the estimated income, and therefore the estimated stock price, up. But an upward revision in interest rates - maybe because inflation is getting out of control? - will depress NPV and therefore push the estimated stock price down.

So if next year’s GDP growth is expected to be 3%, what does that mean for stocks? NOTHING! Because of expectations! If yesterday’s expectations were for 3% growth, there should be little to no change to the stock market. But if the expectation was for 4% yesterday and today it was revised to 3%? You bet stocks will be down. Doesn’t matter if growth expectations are still positive and higher than average. It is all about the CHANGE in expectations.

Nobody expects the Spanish Inquisition

Before the coronavirus pandemic shuttered the global economy in 2020, financial markets were steaming upward. GDP growth was bumbling around the long-term average - not great but good enough - and the concerns that had triggered a 2018 correction - Fed tightening of monetary conditions and the spectre of a U.S.-China trade war - had abated. The consumer was a source of strength to boot, having de-levered steadily and significantly from the heights of 2008. Valuations were frothy - the Shiller PE ratio was almost double the long term average - and the Fed balance sheet was incredibly swollen, but there was no foreseeable friction to spending and growth.

Then Covid happened in early 2020. When it finally dawned on a critical mass that the pandemic was not confined to Chinese borders, the S&P 500 dropped like a rock, roughly 34% over a month, reversing over 3 years of ‘gains’. What could cause such a significant drop? It was unclear how lethal the highly contagious virus was, which created uncertainty about economic growth because of the potential knock on effects on productivity and supply chains. Sick or not, if you have to stay at home and isolate, you can’t go to work, factories stop producing goods, people go to the shop less often and spend less, companies have less income to pay off their loans, and so on with the knock on effects creating a completely unforeseen and unknown impact on global growth. Given the frothy market multiples, it wouldn’t have taken much to take out the market steam (as shown by the 2018 correction), but given the existential threat it posed, the pandemic took a sledgehammer to growth expectations.

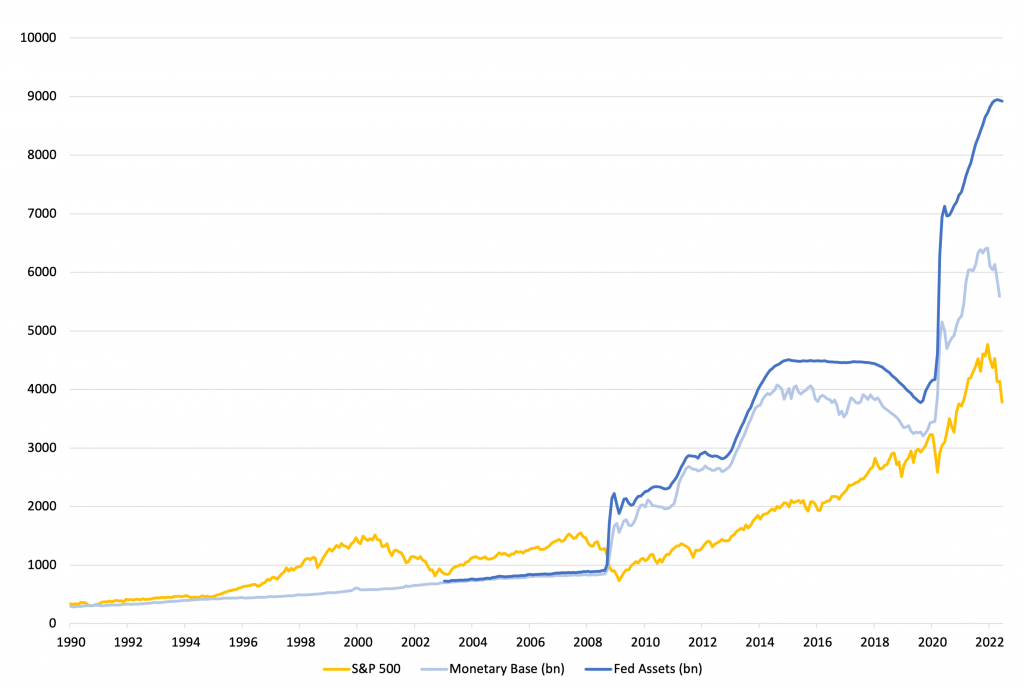
What about the rebound? Does that mean growth expectations suddenly changed? Kind of, sort of. In late March 2020, the Fed and Congress basically came in like the Avengers and said they wouldn’t let the world burn down; they would provide $2.2 trillion in stimulus, and resume asset purchases and institutional backstops so the ceiling didn’t cave in on anyone. The stimulus would hopefully cushion the negative impact on consumption while the Fed support would keep credit rolling, all with the effect of easing the blow on economic growth. You can see this in the uptick in the Fed balance sheet after March 2020. It didn’t solve all the problems but it put out the fire of fear, easing financial conditions, which is a way of cutting rates without cutting rates. Then the vaccine trials came online and Zoom saved white collar service jobs, buoying up consumption.

Inflation too? What?

It should be clearer now that economic growth (i.e. GDP) and monetary policy (rates) have a direct impact on the assumptions embedded in stock price models and consequently, can cause big swings in the market when expectations and forecasts change. The maniacal focus on growth, rates, and now inflation, is not unlike an evangelist’s focus on God. It explains why, during my bank interview many years ago, the equity research head asked if the industry should be so focused on growth. Me being me, I didn’t think about who I was talking to and said no immediately, asserting that was basically antithetical to nature (of course, not as eloquently as that). I also emailed him the day after saying I didn’t want to ‘do’ equities, and instead wanted to be a bond girl. I think all of that probably told him way more about my character than I realised then…

Specifically, *this* Bond girl.

Anyway, if you’ve read this far, you’re probably irritated with me because it seems I suddenly just dropped inflation in the mix. Next time.

grounding: cheap abundant panacea or pseudoscientific b.s.?

by Jennifer Kapila

Grounding, a.k.a. earthing, is the act of maintaining direct physical contact with the earth, free of an insulating barrier like shoes, socks, non-earthen floors, ‘air’ (in the case of multi-tiered buildings). Before industrialisation and urbanisation, this ground connection was the norm, rather than the exception; people walked barefoot or on thin leather soles, and they slept and tread on earthen floors. Then, there was no ‘purpose’ to grounding. Today, it is an alternative therapy that reduces chronic inflammation and accelerates wound healing for its advocates. For others, it’s ‘bullshit’, ungrounded in science.

Reconnecting to the Earth doesn’t cure you of any disease or condition….It restores you body’s natural internal electrical stability and rhythms, which in turn promote normal functioning of body systems, including the cardiovascular, respiratory, digestive and immune systems.

How do you ‘do’ it?

To get the purported benefits, you need to have at least 20-30 minutes of direct skin contact with the earth. The more skin contact, the better, but palms and soles are the best shortcuts because of the abundance of nerve endings, and the sweat helps conductivity. If you don’t have access to the earth - you work in an office, live in an urban jungle, sleep in a high-rise - there are grounding mats and sheets that allow you to get the earth connection through your electrical outlet and grounding rods.

But how does it work?

The planet is a six sextillion…metric ton battery that is continually being replenished by solar radiation, lightning, and heat from its deep-down molten core…the rhythmic pulsations of natural energy flowing through and emanating from the surface of the Earth keep the biological machinery of global life running in rhythm and balance

I could be totally wrong, but here is my simplistic understanding of the ‘mechanics’ of Earthing.

  • Humans - as all forms of life - are electrically charged beings. If human matter (here, cells) is made up of atoms, and atoms are made up of protons and electrons, then obviously our body is comprised of a ton of ‘charged’ matter. A more direct way to think about it - because really, I’m basic and think of electricity as nothing more than the bolt of lightning on my laptop - is through sports drinks like Gatorade. You drink them to to replenish the electrolytes you lose through sweat (or diarrhea or vomiting). There is a fine balance of electrolytes in our system. They are essential to the functioning of our bodies and they make our fluids conductive.
  • Every moment, our body is bombarded by the atmosphere (like UV radiation) and pathogens, all of which are sources of free radicals. Free radicals are electron-seeking molecules; they strip electrons from the cells of your body. This stripping of electrons creates cellular damage, the basis of the process of ageing.
  • But the earth is like a giant, self-replenishing antioxidant that neutralises the free radicals ravaging our bodies. It is a negatively charged entity because it is a repository of electrons, regularly replenished by solar radiation (sunlight), lightning, and thermal activity. The earth neutralises the damage of the free radicals by giving them what they want, electrons, and in doing so, diverting them away from healthy cells.

Essentially, the environment is constantly leaching resources from the human body and the human body replenishes itself from the earth through the ground connection. However, oxidative stress - an imbalance in free radicals and antioxidants at the foundation of chronic inflammation and disease - has rocketed in the post-industrialised era.

The authors of Earthing attribute this to the progressive disconnection from the Earth through the prevalence of rubber/wooden-soled shoes and the byproducts of urbanisation, such as asphalt roads, concrete pathways, wooden or elevated floors, elevated sleep surfaces, etc. That could explain the ‘reduction’ of the antioxidant but on the other side of the equation, there has been a ratcheting up of free radicals in our environment through ozone thinning, processed foods, and electrical systems that have enabled instant global communication. In other words, modern life has created the ideal conditions for oxidative stress to flourish.

Is this b.s.? Where is the evidence?!

Many people will dismiss earthing out of hand because it lacks scientific rigour. Earthing lays out a plethora of cases illustrating how the practice has helped people overcome or diminish symptoms associated with a variety of conditions including, but not limited to, insomnia, allergies, autoimmune conditions, arrhythmias, and hormonal imbalances (PMS and menopause).

However, the technical studies are few and small in scope. The truth is, the studies that are required of a therapy/palliative to gain acceptance by the medical establishment are incredibly expensive to run. I try not to be cynical, but in practice, if there is no money to be made on the other side of the study and short of a pandemic, a large-scale study will never get off the ground.

When it comes to supplements and alternative therapies, I don’t look for scientific evidence. My constraints are 1) safety and 2) cost. If something is relatively cheap (compared to a medical procedure or drug, or requires little effort) and does no harm, then I try it. Unfortunately, many people need to believe in ‘the science’ before they are willing to try something. Yet how many times have scientific ‘truths’ of the past been proven wrong?

My own experience

If you look at the cover of Earthing, it is easy to dismiss it - it suffers from that cheap, self-published look which denotes a lack of credibility. But I picked it up because I knew it already worked for me and I wanted to understand the mechanism.

In covid times, I got ill. Really ill. It wasn’t covid but tonsillitis and it knocked me out for two weeks. Suffering from cracking headaches, fatigue, brain fog, and a lot of anxiety, I was advised by loved ones (who are *very* tied to the medical establishment) to go outside, take a leisurely walk in the huge park on my doorstep and get lost in nature.

I did just that. Or rather, I went a step further, sat on the grass and finally, lay down with my head in contact with the earth. After a few minutes, I felt like going to sleep. Whereas usually I am restless and keen to keep moving, I found that I could have spent hours outside on the ground. It was, to my total surprise, the most effective therapy for my illness. All the pain and anxiety simply bled away.

After that, I bought a cheap grounding mat and Earthing. Later, I purchased a grounding sheet for the bed and find I no longer wake up in the middle of the night. Do I believe the science? I don’t know. And honestly, I don’t really care. If it’s a placebo, I’ll take ten.


Quotes taken from Earthing, by Ober, Sinatra, and Zucker. Photo by Ramesh Iyer on Unsplash

  • Go to page 1
  • Go to page 2
  • Go to page 3
  • Interim pages omitted …
  • Go to page 5
  • Go to Next Page »

Primary Sidebar

S & W

a distillation of ideas across economics, culture and history by an artist that can't shake her fascination with financial markets

Search

History through the lens of money (or how I finally started to understand inflation)

Four Futures: Life after Capitalism

How Christianity created the Liberal

Drugs and the Making of China

Sapiens: Narrative and the History of Humans

Copyright © 2025 · WordPress · Log in